


About The Product
BeautyTrak is an e-learning provider platform designed to connect salon professionals with essential business resources and industry experts. They help salon owners find the information, money, and training they need to make their businesses grow and succeed.
BeautyTrak's platform features three courses designed with impactful lessons and interactive activities. This case study takes you behind the scenes to explore the making of a crucial activity, showcasing the thought process and expertise that goes into our learning design.
The 'Evaluating your business' activity serves as the marquee activity for BeautyTrak students. It allows them to get information related to the most important business metrics and help them grow their business with personalized insights and recommendations.
The Problem
BeautyTrak must provide an impactful flagship activity in their course, to teach salon professionals how to evaluate their business performance without feeling overwhelmed.
The Solution
Create an engaging and accurate activity which helps salon professionals understand crucial business metrics for their business growth, by helping them digest complex information easily.

What We Achieved
40%
higher activity engagement rate
0.85
usability sentiment score
70%
increase in task completion rate
Understanding The Product and Business
Product Requirement
-
The activity should be intuitive and easy to fill out on mobile.
-
It should make heavy use of movement and progression ques to ensure users remain engaged.
Business Goals
1. Establish BeautyTrak as a leading platform for business performance education in the salon industry through an engaging and user-friendly activity.
2. Empower salon professionals to confidently evaluate their business performance using key metrics.
3. Provide personalized insights and actionable recommendations for salon professionals.
Understanding The Users
Who are our Users ?
1. Single operators (no help) - These are people that provide services individually. For the purposes of this activity they will not structure their business with payroll i.e. they will take all earnings directly
2. Single operators (with help) - They operate primarily as single operators but will employ help either as stylist or assistants. They will pay salaries through the business and pay themselves a salary as well.
3. Salon owners (no individual work, employs a team) - They no longer perform services themselves and instead make money from employing a team. They will pay salaries through the business and pay themselves a salary as well.
User Goals
Post Completion users should be able to understand :
Overall Business Health
-
How much current revenue they are generating?
-
How many services do they need to perform to breakeven?
-
What are their top 3 most profitable services?
-
Should they prioritize different services?
Opportunities for Growth
-
How close or far are they from their revenue goals?
-
If they hired help how would that impact their key metrics?
How Might We
How might we make the learning activity engaging such that it helps the users digest complex information easily and effectively?
User Flow Diagram
Based on the design brief, the final user flow diagram was created, after iterating and discussing with the product manager. The original flow consisted of extra sub-activities which were supposed to help the user earn even more money. However, the activity lost it's focus from the original outcome and ended up being more lengthy. In order to simplify the flow and bring back the emphasis on the key metrics, we decided to remove the sub-activities from the main flow and kept them optional at the end of the EYB activity.

Design Principles
Engagement
Easy to understand and Navigate
Error Reduction
Consistency and Familiarity
Minimize Cognitive Load
Outcome Driven
Key Constraints
-
Strict Product Launch Deadline: The project is bound by a firm product launch date, imposing a critical time constraint on all development activities.
-
Rapid Prototyping and Iteration: To facilitate quick and efficient decision-making processes, accelerated prototype building and testing was required.
Flow 1 - Introduction


The introduction step is about setting up the background for the accurate activity results. Firstly, Students will select the type of business owner they are, followed by the questions they want the answer to. And lastly they will check the Total cost worksheet table with 'one time expense' and 'monthly expense' from the previous activity, to ensure all the details are correct.


As this was a mobile first design, a lot of emphasis was put on mobile focused interaction design.
The design focus was on the user being able to edit the table intuitively and effectively without any errors.
Table design options
The 'Total Cost Worksheet' table is supposed to give the user an estimate of all the costs involved for various services needed in the beauty business. As this was an important piece of information, I made different design options for the table followed by usability testing sessions. Based on the internal discussion with Product manager coupled with data gathered from the usability studies, we decided to proceed with option D as it fulfilled the functionality of the table most accurately.
Below were the design options for the 'total cost worksheet' table.

Flow 2 - Key Metrics


As this was a mobile first design, a lot of emphasis was put on mobile focused interaction design.
The design focus was on the user being able to edit the table intuitively and effectively without any errors.


In the step 2 of key metrics flow, translating the service table design from desktop to mobile without losing it's essence and important information was a challenge.
Below images shows the table options for the mobile screen. Option 2 was selected as our goal was to keep the interaction in a way that the user can skim all the information at one glance.


The goal of step 3 in the key metrics flow is to gauge the traffic on each service on different days of the week.
For the mobile design, keeping the mobile interaction design constraints in mind, we opted for an accordion menu to avoid long scrolling. User has freedom to select the day they want to edit and close the menu after editing.
Flow 3 - Metrics Output

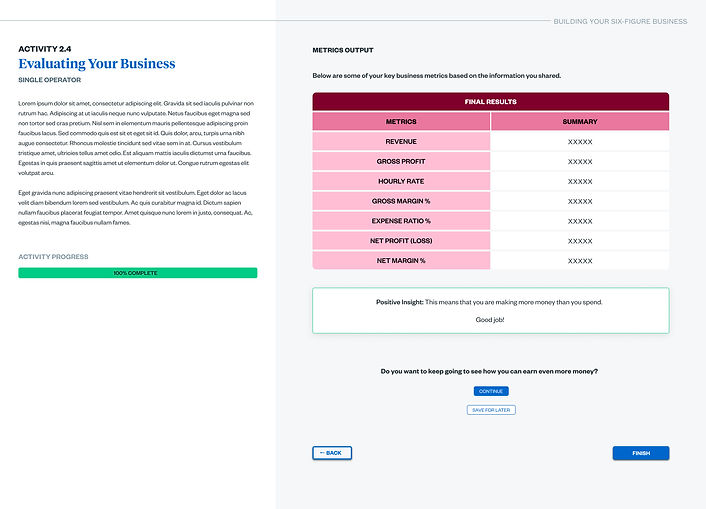
After completing all the previous steps successfully, the business student receives final results with key business metrics and summary of their spending.
Based on the results, the system compares the metrics with the user's set business goals, and provides the user either a positive or negative insight about their current business performance.

Key Takeaways
-
Mobile-first design is significant because it builds a streamlined and user-friendly experience that scales to all screen sizes by focusing on essential content hierarchy.
-
Adapting designs from desktop to mobile requires a strategic and significant redesign to optimize for touch interactions and the constraints of limited screen space on mobile devices.
-
Presenting tables effectively on small screens requires thoughtful design solutions, often involving creative alternatives to ensure impactful data display.
-
It's essential to understand how people use different devices. Prioritizing what's important and iterative testing across devices is crucial for achieving optimal usability on various screens.